This data set is taken from https://www.data.gov/food/ and is for analysis purpose only.
Note: This example uses Tableau to perform data Preparation and analysis in this example.
Data Preparation: Data Preparation is very first and crucial step in data analysis. In this process we basically collect the needed data on which we want to perform analysis. Do the cleaning/formatting a data so that our analysis software/machine can understand it better and if needed sometimes we may need to consolidate the data from multiple sources as well.
We need to do data preparation is many cases as below:
- Data is not as per machine standards i.e. it can be made for better human understanding but software such as Tableau may not be able to read data correctly.
- Multiple sources needed for analysis purpose. Sometimes we need to perform data blending/joining before creating the dashboards
There could be many other business reasons for which we may need to to have data preparation phase in our analysis cycle.
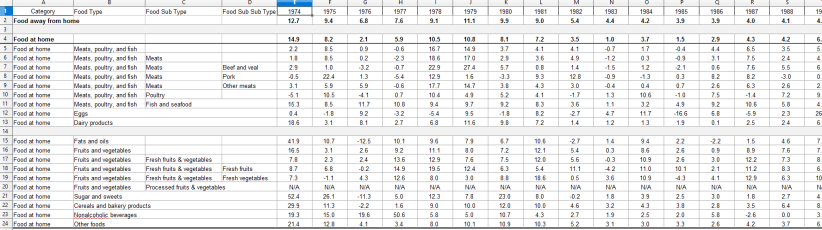
Below is the example of data which is good for human readability but not good for Tableau to read:
If we see this data it is very neatly created and easy to understand but machine may find below issues while reading it:
- First line which is more like information i.e. “Consumer price indexes historical data, 1974 through 2016” , cant be used in analysis and it does not have any meaning for Tableau.
- There are hidden columns between Annual 1979 and Annual 2016.
- There are blank lines in between to increase readability.
- Columns are merged to give categories to data.
- Tableau can perform summary while doing the analysis so we really don’t need additional summary row as Row 5.
Below is the after modifications picture of the same file. In this file below are the changes:
- Categorized the food
- Better column names
- Show hidden columns
Blank rows are not removed as Tableau 10 takes care of that automatically with the help of DATA INTERPRETER. Below is the picture on how Tableau will read this data:

Now you can perform all type of analysis on this data i.e we can pivot the data by making years into columns and other stuff.
Let me know if you need more information on this topic . Your likes/dislikes about the content posted by me so that I can improve it.
